반응형
Python으로 데이터를 다루는 업무에서 Pandas는 거의 필수적이다. Pandas는 쉽고, 빠르고(Python에 비해), 유용하고, 간편하기 때문이다. 또한, 테이블 형태의 구조를 가지고 있는 pandas DataFrame은 매우 친숙하고, 안정적인 느낌을 준다. 평소에는 Pandas의 사용하는 기능만 사용하고, 필요한 기능이 있으면 그때그때 알아보면서 사용하고 있는데, 이번 기회에 Pandas의 함수를 정리해보고자 한다.
(사실 pandas의 전체 함수를 정리하는 것은 거의 불가능하다. 내 기준으로 많이 사용하고 유용할 것 같은 함수를 정리했다. 필요한 함수가 있다면 https://pandas.pydata.org/docs/reference/index.html 를 직접 참조하는 것이 좋을 것이다.)

Pandas의 데이터 구조
- Series : Pandas의 series는 1D array와 유사한 데이터구조로, index와 value로 구성되어 있다. Series가 1D의 형태를 가지고 있다 보니, axis가 1개 존재하는데, 이 axis를 index라고 한다. value로는 ndarray나, dictionary, 스칼라 값들이 들어갈 수 있다.
- DataFrame : DatFrame은 2D의 데이터 구조로, SQL 테이블과 비슷하게, column과 row로 구성되어있다. DataFrame의 각혈은 Series로, DataFrame은 칼럼명이 key인 Series들의 dictionary로 생각할 수 있다. DataFrame은 Series나 2D ndarray, 다른 DataFrame, 1D 데이터(ndarray, list, Series 등등..)들로 구성된 Dictionary를 통해 만들 수 있다.
- 기본적으로 DataFrame은 Numpy를 기반으로 만들어졌다. 따라서, Series는 Numpy 1D 배열(ndarray)과 동일하다고 생각하면 된다. 때문에, numpy에 있는 거의 모든 함수들이 Pandas 데이터 구조에 호환된다.
Pandas의 함수
[Indexing/Selection]
- Indexing/Selection은 Python의 리스트처럼 매우 직관적이여서, 공식 사이트의 부분으로 설명을 대체한다.

- query : 위에서 나온 DataFrame 기본 indexing 말고도, SQL 형식으로 DataFrame에서 조건에 맞는 row를 가지고 올 수 있다.
import seaborn as sns

if __name__ == '__main__':
    titanic_data = sns.load_dataset("titanic")
    print("[query 출력값]")
    print(titanic_data.query('age > 30'))
- between : 특정 숫자형 열의 범위 내의 데이터를 filtering하기 위해 사용할 수 있는 함수이다.
import seaborn as sns

if __name__ == '__main__':
    titanic_data = sns.load_dataset("titanic")
    print("[between 출력값]")
    print(titanic_data[titanic_data['age'].between(30,40)])
[데이터 연산]
- 사실 Series와 DataFrame이 많이 사용되는 이유이기도 한데, Series나 DataFrame 끼리 연산이 된다.
- 단순 연산이 간단할 뿐 아니라, 간단한 연산 위주로 수행한다면, 속도가 매우 빠르다. (Pandas는 numpy로 구성되고, numpy는 C로 변환하여 연산을 하기 때문에)
import pandas as pd
import numpy as np

if __name__ == '__main__':

    df1 = pd.DataFrame(np.arange(10))
    df2 = pd.DataFrame(np.arange(10)*2)

    print(df1+df2)
    print(df1-df2)
    print(df1*df2)
    print(df1/df2)
[데이터 읽기&쓰기]
- read_csv, read_excel : 각각 csv 형태, excel 형태를 쉽게 읽어서, DataFrame 형태로 반환한다.
- to_csv, to_execel : DataFrame을 각각 csv, excel 형태로 export 한다.
[데이터 요약&추출]
- head : DataFrame의 처음 N개(인자값) 행을 출력한다. (default:5)
- tail : DataFrame의 마지막 N개(인자값) 행을 출력한다. (default:5)
- sample : DataFrame에서 무작위 행 N개를(인자값) 추출한다. (default:1), DataFrame의 행을 무작위로 섞고 싶다면, frac 인자(추출 비율)를 1로 지정하면, 전체 DataFrame이 무작위로 섞여서 나온다.

- describe : DataFrame의 칼럼 중, 숫자 칼럼에 대한 통계값(평균, 표준편차, 최솟값, 사분위수, 백분위수, 최댓값)을 표현해 준다.

- value_counts : Series 객체 내의 unique value의 빈도를 반환한다. Categorical 데이터 개수 파악에 주로 사용한다.

- dtypes : dtypes는 함수가 아닌 속성이다. 각 열의 데이터 유형을 출력한다. pandas의 DataFrame은 기본적으로 열의 데이터 유형을 추정하는 방식을 사용하기 때문에, 추정한 유형을 알기 위해 출력이 필요하다.
- info : DataFrame의 각 칼럼 값과, Index 범위, not null 인자 개수, 데이터 타입, 메모리 정보를 출력해 준다.

import seaborn as sns

if __name__ == '__name__':
    titanic_data = sns.load_dataset("titanic")

    print("[head 출력값]")
    print(titanic_data.head(5))
    print("[tail 출력값]")
    print(titanic_data.tail(5))
    print("[sample 출력값]")
    print(titanic_data.sample(5))
    print("[describe 출력값]")
    print(titanic_data.describe())
    print("[value_counts 출력값]")
    print(titanic_data.value_counts())
    print("[dtypes 출력값]")
    print(titanic_data.dtypes)
    print("[info 출력값]")
    print(titanic_data.info())
[데이터 결합]
- combine_first : 두 DataFrame을 결합할 때, 첫 번째 DataFrame이 누락된 경우, 두 번째 DataFrame의 값으로 대체하는 값이다. DataFrame을 이용한 coalesce or nvl 함수라고 보면 된다. 어떠한 DataFrame에 비어있는 값을 다른 DataFrame의 값으로 대체하기 위한 함수이다.
- combine : 두 DataFrame을 결합할 때, 개발자가 정의한 함수에 따라서 결합하기 위한 함수이다. combine_first가 단순히 하나의 DataFrame에 없는 값을 대체해 주는 것에 비해, combine은 결합 조건 및 결합 방식을 직접 정의 가능하다.
- concat : DataFrame을 단순히 쌓는다. axis가 0이면, row에 append 하는 구조로 DataFrame을 결합하고, axis가 1이면 칼럼이 늘어나는 방식이다.
- join : SQL에서의 join처럼 두 DataFrame 간의 join을 위해 사용되는 함수이다. 다만, 인덱스 기준으로 DataFrame을 결합하기 때문에, index를 가공하지 않으면 사용이 제한적이다. join 방법을 지정하는 how 인자에 left, right, inner, outer를 지정할 수 있다.(default left)
- merge : 조금 더, 유연한 방식의 join 방법이다. join은 DataFrame 함수이고, merge는 pandas 함수이기 때문에, join은 인덱스 기준으로만 join이 가능한 반면, merge는 join key를 지정해 줄 수 있다. 인자는 다양하지만, join key를 지정하는 "on", join 방식을 결정하는 "how" 정도만 사용하면 된다. "how" 인자로는 join과 마찬가지로 left, right, inner, outer를 지정할 수 있지만, default 값이 inner join이다.
import pandas as pd
import numpy as np

if __name__ == '__main__':
    df1 = pd.DataFrame({'data': [1, 2, np.nan, 4, 5, 6]}, index=[np.arange(6)])
    df2 = pd.DataFrame({'data': [0, 0, 5, 0, 0, 0]}, index=[np.arange(6)])

    df1.columns = ['key']
    df2.columns = ['key']

    combine_df1 = df1.combine_first(df2)
    combine_df2 = df1.combine(df2, lambda x, y: x ** 2 + y ** 2)
    concat_df1 = pd.concat([df1, df2], axis=0)
    concat_df2 = pd.concat([df1, df2], axis=1)
    join_df = df1.join(df2, how='inner',lsuffix='left', rsuffix='right')
    merge_df = pd.merge(df1, df2, on='index', how='inner')

    print("[combine_first 출력값]")
    print(combine_df1)
    print("[combine 출력값]")
    print(combine_df2)
    print("[concat 행 방향 출력값]")
    print(concat_df1)
    print("[concat 열 방향 출력값]")
    print(concat_df2)
    print("[join 출력값]")
    print(join_df)
    print("[merge 출력값]")
    print(merge_df)
[데이터 변환]
- apply : pandas에서 가장 유용한 함수라고 생각한다. 인자로 함수를 넣어주면, DataFrame의 각 행에 함수를 적용할 수 있다. 일반적으로 간단한 연산들은 단순 반복문보다 apply로 처리하는 게 속도적으로 유리하다.
- fillna : DataFrame이나 Series의 누락된 값을 다른 값으로 채울 수 있다. 보통 결측치를 보정하는 데 사용한다.
- replace : DataFrame의 특정 값을 다른 값으로 변환해 준다.
- map : dictionary 형태의 mapping을 통해, DataFrame 내의 값을 다른 값으로 mapping 해줄 수 있다.
import seaborn as sns

if __name__ == '__main__':
    titanic_data = sns.load_dataset("titanic")

    print("[apply 출력값]")
    print(titanic_data['fare'].apply(lambda x: (x+10)*2))
    print("[fillna 출력값]")
    print(titanic_data['age'].fillna(titanic_data['age'].mean()))
    print("[replace 출력값]")
    print(titanic_data['sex'].replace('male', 1))
    print("[map 출력값]")
    print(titanic_data['sex'].map({'male':1, 'female':2}))
[집계 함수]
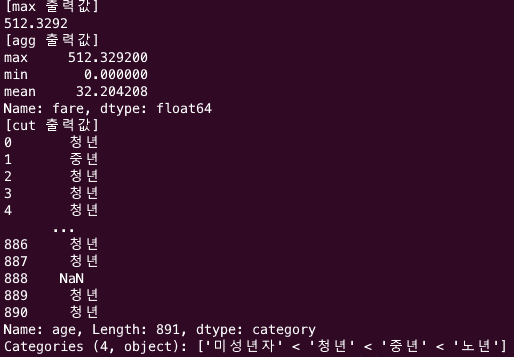
- mean, max, min, sum, median, std, count : pandas의 DataFrame은 Table 형태의 구조를 띄고 있기 때문에, 집계가 매우 용이하다. DataFrame의 특정 칼럼을 지정하고, 해당 함수를 사용하면, 칼럼의 통계값을 쉽게 얻을 수 있다.
- agg : 집계를 한 번에 적용할 때, 쉽게 사용할 수 있다. 보통 groupby와 함께 자주 사용된다. axis가 0이면 칼럼별로, 1이면 행별로 함수를 적용한다.
- cut : 연속형 데이터를 구간으로 나누는 데 사용된다.
if __name__ == '__main__':
    titanic_data = sns.load_dataset("titanic")

    print("[max 출력값]")
    print(titanic_data['fare'].max())
    print("[agg 출력값]")
    print(titanic_data['fare'].agg(['max', 'min', 'mean'], axis=0))
    print("[cut 출력값]")
    bins = [0, 18, 35, 50, 100]
    labels = ['미성년자', '청년', '중년', '노년']
    print(pd.cut(titanic_data['age'], bins=bins, labels=labels))
[정렬 함수]
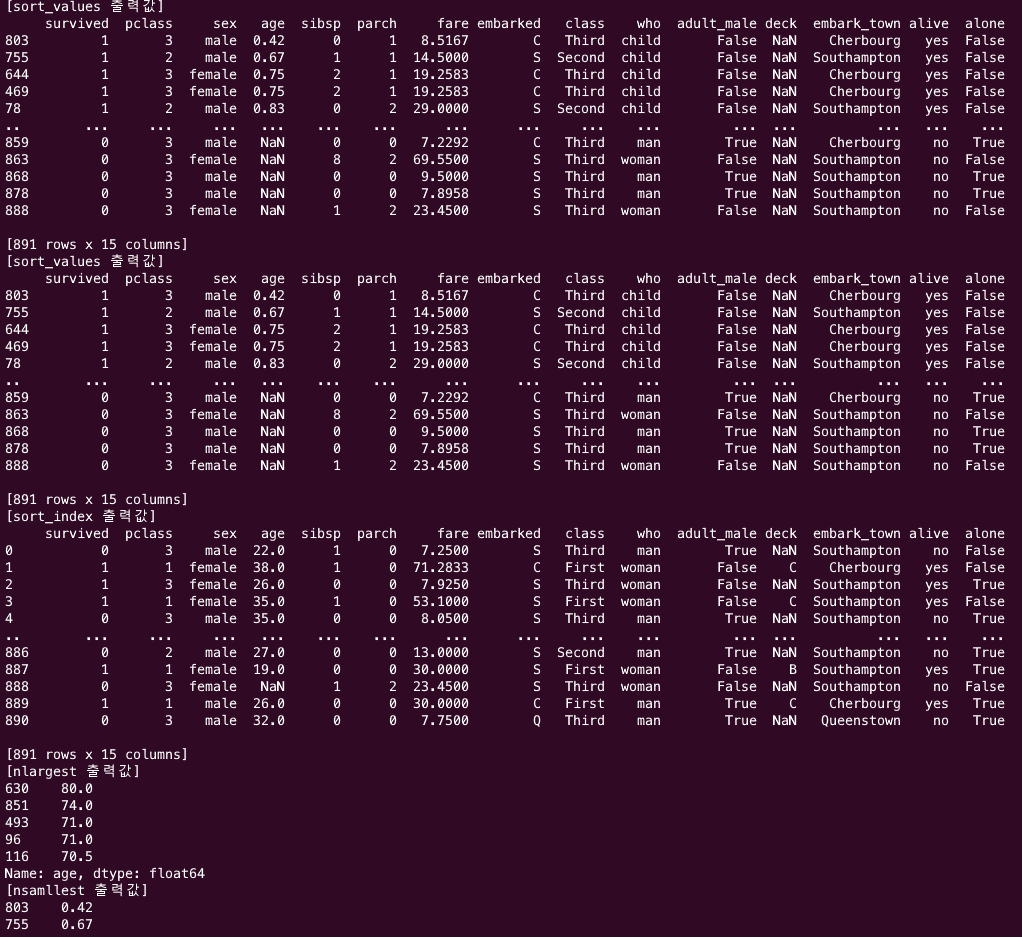
- sort_values : SQL의 orderby 함수처럼 특정 칼럼의 값에 따라 정렬할 수 있다. 기본적으로 오름차순으로 정렬한다."by" 인자에 열을 명시해줘야 한다.
- sort_index : Index 기반으로 DataFrame을 정렬한다. 마찬가지로 기본적으로 오름차순으로 정렬한다.
- nsamllest, nlargest : 각각 DataFrame 내에서 가장 큰 값, 가장 작은 값 N개를 가진 행을 찾는 데 사용된다.
if __name__ == '__main__':
    titanic_data = sns.load_dataset("titanic")

    print("[sort_values 출력값]")
    print(titanic_data.sort_values(by='age'))
    print("[sort_values 출력값]")
    print(titanic_data.sort_values(by='age'))
    print("[sort_index 출력값]")
    titanic_data = titanic_data.sample(frac=1)
    print(titanic_data.sort_index())
    print("[nlargest 출력값]")
    print(titanic_data["age"].nlargest(5))
    print("[nsamllest 출력값]")
    print(titanic_data["age"].nsmallest(5))
[그 밖 유용한 함수들]
- groupby : SQL의 groupby처럼 DataFrame을 grouping 하여, group 별 집계, 연산에 사용하는 함수이다. groupby key를 지정해 주면, 해당 기준으로 grouping 된다.
if __name__ == '__main__':
    titanic_data = sns.load_dataset("titanic")

    group_titanic_data = titanic_data.groupby('sex')
    print(group_titanic_data)
    print(group_titanic_data["fare"].max())
    print(group_titanic_data["fare"].mean())
    print(group_titanic_data["fare"].min())
    print(group_titanic_data["fare"].agg(['max', 'mean', 'count']))
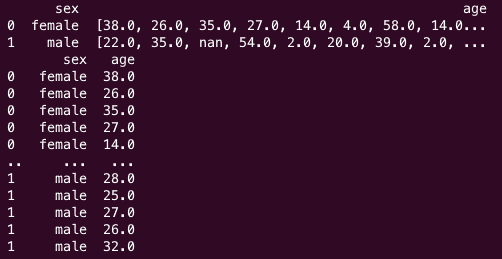
- explode : SQL의 Unnest와 같다. DataFrame 내에 List 또는 Series로 저장된 요소들을 분해하여 풀어내는 데 사용된다. 길이가 같은 여러 칼럼의 list를 한 번에 풀 수 있는 게 매우 유용하다. (spark에선 이 기능이 직관적이지 않다.)
if __name__ == '__main__':
    titanic_data = sns.load_dataset("titanic")

    group_titanic_data = titanic_data.groupby('sex')
    # group by를 통해 각 age 요소를 list 형태로 만듬
    group_data = group_titanic_data['age'].agg(list).reset_index()
    print(group_data)
    print(group_data.explode('age'))
'Python' 카테고리의 다른 글
| Scikit-learn 주요 함수 정리 -(1) 전처리, 특성추출, 평가 함수 (48) | 2024.01.18 |
|---|---|
| Multiprocessing으로 Pandas Apply 속도 향상 하기 (41) | 2023.11.13 |
| Pypi 사용법 & 명령어 모음 & 폐쇄망 사용법 (1) | 2023.08.16 |
| JAX: Just Another XLA 설명 (2) | 2023.08.07 |
| Pandas 성능 향상을 위한 방법들 (2) | 2023.07.21 |


